
You are using an out of date browser. It may not display this or other websites correctly.
You should upgrade or use an alternative browser.
You should upgrade or use an alternative browser.
This season will vindicate Ty Corbin
- Thread starter franklin
- Start date
It's because I tweeted him this badass Rudy Gobert graphic the other day: https://s1092.photobucket.com/user/poindexter3/media/Gobert Effect_zpsnm7r198z.jpg.html
Can anyone figure out why that won't embed? I've posted a hundred pictures from that account here.
From the link you posted, I copied the "direct" link and it worked like a charm.
I never had an issue with his late clock management, and always saw the complaints as coming from those waiting with baited breath. They started with that inbounds play that Jefferson screwed up and Mo chucked a long contested three. It was a pretty common triangle post with a cross screen for a three play, but Jefferson wandered out to the 3 point line instead of posting up deeper. If you find that game thread you'll see fans were looking for something to bitch about and nobody actually used any bball knowledge to analyze the situation.
That continued on through this season with fans complaining that Corbin chose to take the ball out of Dirk's hands (clutch 90+% free throw shooter) before fouling. It was great in game coaching yet he got berated for it -- mostly because Grantland felt slighted by his refusal to answer there questions and have been on a tirade ever since.
I'm not really familiar with other people's complaints on this particular issue. My criticism here is based 100% on my own observations. I'm not a very knowledgeable fan as far as X's and O's go, self admitted, but I've watched a fair bit of Jazz basketball and I was consistently frustrated with Ty's short clock strategies (or lack thereof).
I'd hope you'd give me more credit than just some guy parroting other people's complaints.
DutchJazzer
Banned
It's because I tweeted him this badass Rudy Gobert graphic the other day: https://s1092.photobucket.com/user/poindexter3/media/Gobert Effect_zpsnm7r198z.jpg.html
Can anyone figure out why that won't embed? I've posted a hundred pictures from that account here.
ur pic wont embed cus it ends in html.
so the mebedding system is confused
fishonjazz
Well-Known Member
Contributor
2018 Award Winner
2019 Award Winner
20-21 Award Winner
2022 Award Winner
2023 Award Winner
2024 Award Winner
2025 Award Winner
I'd hope you'd give me more credit than just some guy parroting other people's complaints.
Lol, ya right.
If you disagree with him, then you a parrot bruh
D
Deleted member 848
Guest
What is this graph trying to propose?
I'm not really familiar with other people's complaints on this particular issue. My criticism here is based 100% on my own observations. I'm not a very knowledgeable fan as far as X's and O's go, self admitted, but I've watched a fair bit of Jazz basketball and I was consistently frustrated with Ty's short clock strategies (or lack thereof).
I'd hope you'd give me more credit than just some guy parroting other people's complaints.
Of course. Didn't mean to come across otherwise. Just giving the way I see things.
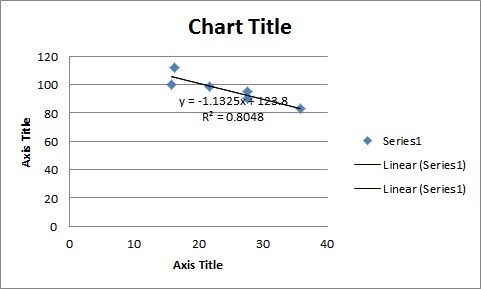
What is this graph trying to propose?
It's Rudy's playing time per game by month across Utah's points allowed, by month.
I adjusted from linear to exponential and the r-squared bumped up above 83. Running a curve for analytical chemistry you usually need an r-squared of 99% or better. Getting a correlation of 83% out of something like this is pretty damn impressive given all the variables in sports.
LogGrad98
Well-Known Member
Contributor
20-21 Award Winner
2022 Award Winner
2023 Award Winner
2024 Award Winner
You brought up recency bias a while back and that's what I see when reading your posts here. It's like you've completely forgotten Rudy's play last season. That wasn't coaching, it was youth.
So we go from Ty's coaching was every bit as effective as Quin's to basically coaching matters not. You are a squirmy bugger aren't you? You could give politicians a run for their money. Is the next thing going to be "it depends on what the definition of 'is' is"?
LogGrad98
Well-Known Member
Contributor
20-21 Award Winner
2022 Award Winner
2023 Award Winner
2024 Award Winner
What is this graph trying to propose?
No titles, no definitions and not even enough data points for a true trend. This chart shows literally nothing, or more precisely any random process.
So we go from Ty's coaching was every bit as effective as Quin's to basically coaching matters not. You are a squirmy bugger aren't you? You could give politicians a run for their money. Is the next thing going to be "it depends on what the definition of 'is' is"?
When did I say that? Let me know when you graduate from your jr high coaching is everything mentality.
No titles, no definitions and not even enough data points for a true trend. This chart shows literally nothing, or more precisely any random process.
5 data points is the standard for a curve. If you weren't being sensitive you might appreciate the correlation, even if random.
You're proclaiming your faith in Quin being 100% responsible for Gobert's improvement then claim this statistical correlation shows nothing. I normally take you seriously.
You still haven't explain anything about the graph, so it still means nothing. And yes 5 data points represent a curve.
Read back a few pages. I posted the info several times.
Typically 7 are required to show any kind of actual trend.
You don't know what you're talking about but please explain from your experience pov. I'm always looking to learn new areas. Maybe logistics requires 7 points for a trend because the variability is high, but anyone working in the sciences needs less because the tighter range is much more accurate (working in the 99.5% range, lower and upper bounds).
Again, if you weren't so interested in winning an argument you might be able to appreciate the tight correlation that graphic shows. I'm almost stunned I have to defend the Rudy effect at all. Almost.